How to Evaluate our Trials?
A Visualization Platform
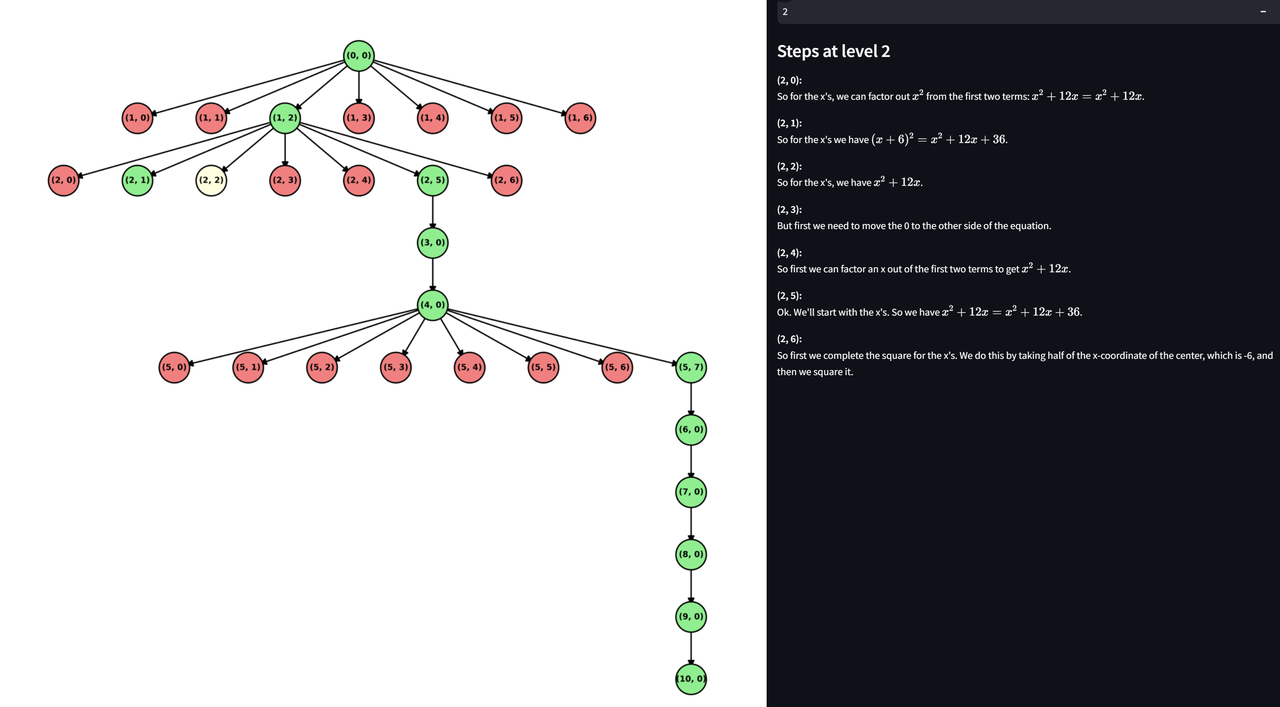
In addition to testing accuracy scores using specific evaluation metrics on benchmarks, manually reviewing actual cases is a crucial step in evaluating data and models. Therefore, to provide a more intuitive way to evaluate the model’s performance on specific problems, we build a visual data analysis platform using Streamlit. Specifically, our visualization platform includes the visualization of synthetic trees and their corresponding long thoughts as well as the output of the trained model. Furthermore, when visualizing results, we support detailed conditional filtering, such as filtering for correctly or incorrectly answered questions, or whether the output contains keywords indicating reflection or hesitation (e.g., “wait”). Additionally, we support comparison between different iterations of synthetic data and model outputs, which makes it highly intuitive and helps us easily validate whether the new round of data or models is effective.
 |
|---|
| Visualizing the constructed search tree through an interactive data analysis platform. |